Pandas GroupBy for Algorithmic Trading: Data Aggregation 27/100 Days

python,python programming,algo trading,algorithmic trading,python for beginners,python for finance,python for trading,python algo trading tutorial,AI in trading,machine learning algorithms for trading,how to build a trading bot with python,trading bot tutorial,algo trading for beginners,what is python language,use of python,python data types,algorithmic trading strategy,pandas library python,pandas,pandas series in python,pandas series,trading with pandas

Recently we have been doing some powerful techniques in pandas which will be definitely helping you in the algo trading so we have seen pandas series we have seen pandas data frame and today we will see another object that is pandas Group by so now you can see that we have multiple ways but in algo trading the time matters so you have to apply the most efficient way and group by is the most efficient way in the Hello friends welcome back to day 27 of The 100 days of hell with python algo trading recently we have been doing some

Powerful techniques in pandas which will be definitely helping you in the algo trading so we have seen pandas series we have seen pandas data frame and today we will see another object that is pandas Group by and this is so crucial and important why because it will help you to get your results faster and more efficiently it will save your time it will save your space and also it is so easy to use you just have to focus in today’s session and you will realize that how powerful this is and before

That I would like to request you that please go through all the multiple choice questions and all the task which we have pushed to the GitHub repository because those are equally important as with the videos because you will have to practice otherwise you will forget right so the best way is to just watch the videos then you attempt the multiple choice questions and then you have to proceed for the task and the mini projects right so without a further Ado let’s get started with the pandas Group

By object so let’s first understand the definition of group by in pandas so a group by is a powerful tool in pandas that is used to split the data pay attention to this word split the data into groups based on some criteria once the data is split into groups you can apply various aggregate functions on these groups so basically we can say that we have three steps so the first step when we apply a group by on any data frame what happens it split that data frame into multiple groups so it depends on the criteria which we have

Applied so it will split that particular data frame into uh the groups then it will apply the functions the aggregate functions so whatever we apply let’s say we apply sum mean median whatever so it will apply on all those groups and then then again after the application of those aggregate functions on those splitted groups it will combine back into a data frame and it will give us the results right for example in our stock trading data we might want to group by the ticker and then calculate the total

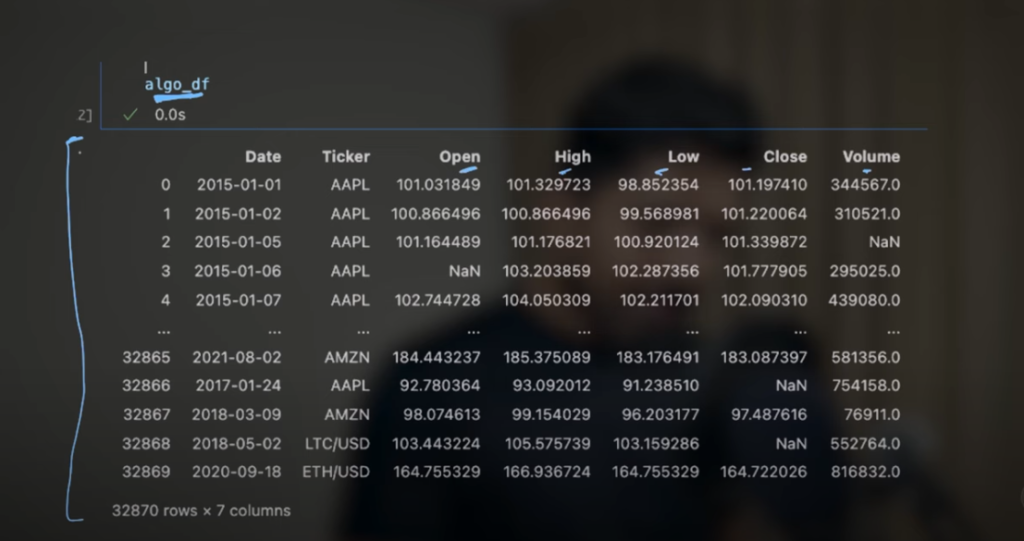
Volume traded for each strock so let me show you if you remember in the last few sessions we have used this data frame alod DF right if you are watching this video first time please go through the previous videos of the pandas series or data frame then you’ll be able to understand about this data frame right anyways if you new also then it’s very basic so when we check this algod DF data frame you will get this output right and we have around 32,000 rows and seven columns in that basically.

We have o h l c v data of the tickers and in that we have a traditional stocks like apple Microsoft then we have Forex and we also have some crypto pairs right so if I apply Group by on these and let’s say if I apply with the ticker right so we know that for a single ticker we have multiple rows in this data frame right what it will do after application of group by on ticker what it will do it will split the whole data frame into multiple groups right so here we had like apple it created a separate data frame of the apple and

Pandas Group
Pandas Group2
Pandas Group5
Pandas Group8

Again the xrp and remaining let’s say we had this data frame here right we applied the group Bion ticker so what it did it created multiple data frames let’s say one for the apple right the another for the Amazon let’s say some another for the LTC USD pair the Crypton one and another for E USD right it depends on how many unique values you have in this column and based on that it will create that number of groups right and after that what it will do whatever we apply it depends on us that what aggregate functions we are

Applying so here what I did here instead of applying an aggregate function I applied simple value counts right so then it went to each one of these Separate Tables right and now it is counting the value so it will give us the number of times that particular row is in that so in this data frame the Apple this particular row is twice right similarly for all the groups it will display the results but here it just truncate and just display as the initial five and the last five values so let’s say we had

This data frame here and we applied Group by on this so what happened it splitted all these results into three data frames you can say so the one table with the X ID another for the Y ID and the last one is for the Z ID correct then we applied sum on that the aggregate function right so it applied on this so we get this result X is 50 then we get 70 on this and then we get 90 on this and the last step is the it combined the values and we got the result back right so the basic step is first we apply the group by here and

Then the first step is split it will split the whole data frame into multiple tables based on the number of unique values in this right and then it will apply the aggregate functions which we provide like it could be sum mean median average anything then it will calculate those functions and again in the last we will get the this is the second step the application of aggregate function and the last step is the we will get a combined result right split apply combine and that’s it hope it’s more clear now don’t worry we’ll proceed with live examples after this.

Let’s say we have another data frame so it got split in three tables the first is yellow the second is green and third is blue correct then what happened then we applied the mean aggregate function on these tables so what it did it calulated the mean of every value so this was the second function the aggregation function right and the last one is it just combine the results and we get a modified data frame so we can say combined results and we get the modified data frame with the mean values of all the different colors so if you can imagine it is really powerful when.

We have millions of values and we cannot see directly that how many groups are there it can be thousand groups and we want to apply some particular function on that it becomes so powerful and you will feel that in algo trading this will be a magic want the group buy will be a magic War for you if you perfect this and I assure you that it is not difficult you just have to practice few questions which we will provide you absolutely free on the website the multiple choice questions and then the GitHub repository task right that’s it if you do that you will be a magician right and you will realize that how helpful this group by object in your algo trading career right let’s have a look on another example so here we have a table in that we are applying Group by on this column the sales representative the first step was split so this whole table got splitted into four or no five tables why because we had five unique values the first one is William Taylor the second is Will the third is Sam the fourth Alvin and the fifth is Helen.

So it got splitted into five tables then we apply this aggregate function on this so we can write aggregate the Second Step it will always be only three steps the split the the function the aggregate function and the third one is combine so we applied the aggregate function so what we did here we applied size function on the order ID right then we applied sum and mean on this value column and the last one is we applied sum and mean on the sale column.

So it calculated the mathematical values and then again the third step is we got the combination of the splitted tables right and this is the results so every time it is same and don’t worry I’ll show you it is very easy in a bit and the last example is this one so here this is an example of of the trades happened on an exchange so this is the account ID this is the order ID and this is the price when the trade executed right so when we apply a group by on this the first step will be split right so what is happening here we have three unique account number the first is this and second is this and third is this one so means these are the values of the the particular account ID right so we got three Separate Tables and then we applied this sum function on that so the second is the aggregation function it could be sum mean median whatever you want so it applied the sum on that so you can see here it will like add these three values and all these values it will add and similarly.

It will add these values so this is the aggregate function and the last step is that we will again combine these tables and we’ll get this result here the third one is combine you can see here we got all these three rows again the sum value on all these five rows and last is the sum value on these four rows so that’s how this group by works and I’m sure that you are able to imagine the possibilities with this group by object and now let’s move and practice some questions on various data sets and let’s see how it

goes okay let’s start with some examples and you will see that in real life scenarios also you will be using these kind of data sets only so what I’m doing here we are creating a data set with 1 million rows it will be a very big data set and you can even change as per your requirements right because in real life also we’ll be having large data sets right because when we have exchange data it is always huge so what I will do here I’ll just run head shift enter now let’s check the data frame DF so you can see.

That we have 1 million rows and seven columns and even if you want you can check the info and you will see that it is almost 53.4 MB so before that what we can do we can just convert this to a uh CSV file so what I will do here I’ll write DF do2 CSV and then we can give the name of CSU file so let’s say Exchange Trade data do CSV right so when we hit shift enter you will see that we have a new file this one and when you click on that you will see the data here right it is huge data so I’ll go back.

Watch this Day 27 video tutorial

Day 27: Pandas GroupBy

1. What does the GroupBy operation in Pandas allow you to do?

2. How can you create a DataFrame in Pandas with one million rows using random data?

3. What is a common use of GroupBy in financial analysis?

4. How would you group a DataFrame by the ‘Year’ column and then get the average of the ‘Profit’ column?

5. Which method is used to apply multiple aggregation functions at once after grouping?

6. What is the result of calling df.groupby(‘column’).size()?

7. How do you group by multiple columns in Pandas?

8. Which parameter can you use with groupby to exclude the grouping columns from the index?

9. What happens if you use the sum() function after grouping a non-numeric column?

10. How can you reset the index after performing a groupby operation?

11. What method would you use to find the group with the highest sum of sales?

12. How would you add a group key as a new column in the DataFrame after grouping?

13. What does the filter() function do when used with a groupby object?

14. Which function can you use to compute the cumulative sum of returns for each stock in a grouped DataFrame?

15. What is the correct way to sort the groups in a grouped DataFrame by their computed mean values?

16. How can you group a DataFrame by one column and aggregate another column using two different functions?

17. What would df.groupby(‘Year’)[‘Sales’].transform(‘sum’) return?

18. Which of these is not a valid way to perform an operation on multiple columns after a groupby?

19. How do you compute percentage change for each group in a DataFrame?

20. How to perform a rolling mean on a DataFrame grouped by ‘Category’ for a ‘Sales’ column?