
A Powerful Tool for Algo Trading Day – 27 | 100 Days of Hell with Python Algo Trading Series
Time is valuable in Algo Trading. Keeping this in mind, in today’s blog, we will learn Pandas GroupBy Object, which not only makes data processing easier but also makes analysis on trading data faster and efficient. In earlier sessions, we covered Pandas Series and Pandas DataFrame. GroupBy is another important Pandas object after them.
What is Pandas GroupBy?
GroupBy is a tool that allows us to divide a DataFrame into groups and then apply different Aggregate Functions (such as sum, mean, median, etc.) on those groups. This process takes place in three main steps:
- Split – dividing the data into groups according to specific columns
- Apply – applying aggregate functions to the groups
- Combine – combining all processed groups into a new DataFrame
This process is known as Split-Apply-Combine.
Why use GroupBy in Algo Trading?
When you work with large data sets (such as stocks, crypto, or forex data) in Algo Trading with Python, you need to draw conclusions quickly. In such a case, Pandas GroupBy:
- Saves time
- Reduces memory consumption
- Performs complex calculations with easy syntax
For example, you can calculate the total volume of trades for different tickers (such as Apple, Microsoft, BTC-USD) in a trading data set.
Example: Applying GroupBy on trading data
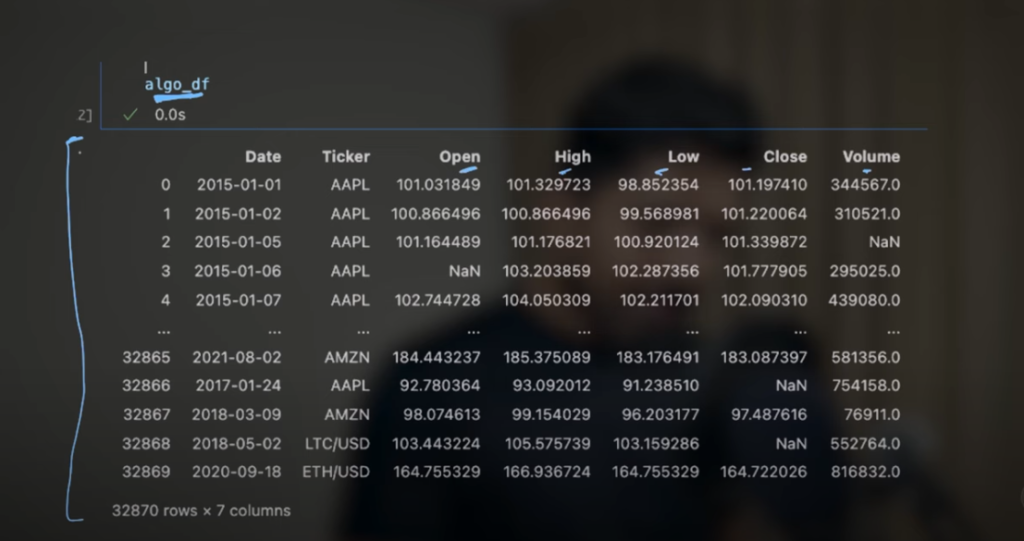
Suppose we have a DataFrame – algod_df, which has more than 32,000 days and 7 columns. It contains OHLCV (Open, High, Low, Close, Volume) data, and includes a variety of assets such as:
- Traditional stocks (Apple, Microsoft)
- Forex pairs
- Cryptocurrencies (BTC-USD, XRP-USD)
Now if we do GroupBy on the ticker column, the DataFrame will be split for different tickers – e.g. Apple, BTC-USD, etc. You can then apply functions like sum(), mean(), or value_counts() on those groups.
For example:
grouped = algod_df.groupby(‘ticker’)
result = grouped[‘volume’].sum()
This code will extract the sum of trade volume for all tickers.
Pandas Aggregate Method – How and Why?
Along with GroupBy, you can also use Pandas’ aggregate() method, which allows you to apply multiple functions (such as sum, mean, count) at once.
grouped.agg({
‘volume’: [‘sum’, ‘mean’],
‘price’: [‘max’, ‘min’]
})
This is especially useful when you want to perform a comprehensive analysis (Quantitative Analysis in Stock Market) based on a trading account or order ID.
Real World Example: 1 Million Daily Data Set
In Algo Trading, we often have to deal with large data sets. Keeping this in mind, a 1 million daily DataFrame has been created and saved in a CSV file:
df.to_csv(‘exchange_trade_data.csv’)
This kind of data is usually more than 50 MB, and it becomes difficult to analyze it without a tool like GroupBy.
Pandas GroupBy: A Magic Weapon for Algo Trading
If you practice it correctly, GroupBy can become a magic wand for you. With this you can:
- Process data faster
- Save time and resources
- And make your trending algorithm more efficient
- Practices and GitHub Resources
The author has uploaded Multiple Choice Questions and Tasks on the GitHub Repository and website, which are very important to do. These will not only strengthen your understanding but will also make your learning practical.
Watch this Day 27 video tutorial
Day 27: Pandas GroupBy
![]()