Stock analysis is a crucial part of algorithmic trading and quantitative analysis. Using Pandas DataFrames, traders can efficiently manage, analyze, and visualize financial data for better decision-making.
Finally this is the day when we learn how to convert a complete naked chart to a data frame and then how we can convert that data frame to a code and you can make your strategy and then how we can convert that code to the dollars right and if you want the percentage then what you can do you can just divide this by the initial price so final minus initial upon initial right so you will have 50 upon 100 and you will get as 0.5 means 50% you are in profit now if you want you can change the kind of this so you
Can make it as and you’ll get a bar chart correct good morning friends welcome back to Day 26 of the 100 days of hell with python algo trading finally this is the day when we learn how to convert a complete naked chart to a data frame and then how we can convert that data frame to a code and you can make your strategy and then how you can convert that code to the dollars right so I will not recommend you to skip this video if you are available then only watch this video please do not watch this video without
Your full Focus watch only when you are fully focused fully concentrated and fully dedicated right so if you are currently busy somewhere please save this video for later because today we will understand the most important functions and attributes of panda series and data frame which you will be using a lot while creating any strategy or any algorithm for your trading and also this is the video for those people who always say that please skip the fundamental part and directly move to the algo trading but in actual I would say 70% is
Your basic and fundamentals because if you are good enough in your basic and fundamentals then the algo trading will become so smooth for you so that’s why I always say please focus on your Basics and once we are done with that then it becomes a piece of cake so as we have seen previously that how we can convert a chart data the ohlc Open high low close to a data frame and then we can convert the data frame and then we can use that data frame for our algorithm and then ultimately we can convert that algorithm do some dollars


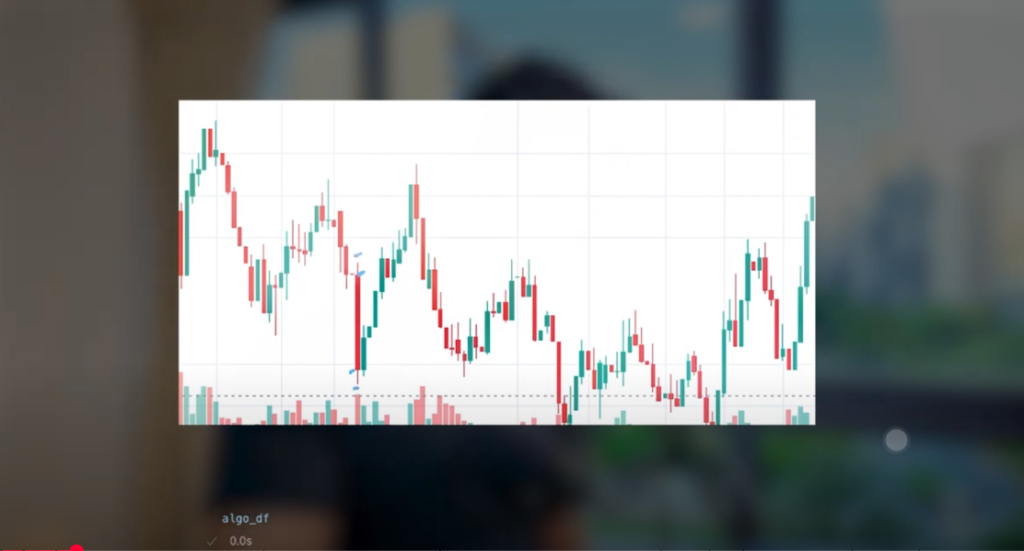
Right so let me quickly revise the O lcv again so previously we have seen that in the righted candle this is the open this is the close this is high and this is low correct similarly in a green candle this is the open let me show you some another candle this is the open in a green candle this is the close this is the high and this is the low and again this is the volume right basically you have open close close high low and the volume v so o h l c v correct so that can be converted to a data frame and why we convert to a data frame because in code we need some series.
We need some numbers we need some integers and that’s why we convert a chart to a data frame and that can be easily analyzed that can be easily manipulated and so on so forth so our main agenda for today is that we will learn some functions which are critical which are important while learning the algo trading and if you learn these attributes and methods then I can assure you that it will become a lot easier and simpler for you to create any algorithm to convert any chart to a code so what.
I have done I have categorized the methods for panda series The Meth methods for pendas data frame and the methods which can be applied on both the pandas series and pendas data frame right if you can see on the screen then we have these methods for the panda series and these many methods for the pandas data frame right and these are the methods which can be applied on both the series and data frame and many of these functions we have already learned and remaining we will learn in this session so what we will do today.
We will practice some real life based algo trading scenarios and you will see that how in real life we convert and how in real life we work on data how we clean the data how we analyze the data and how we can manipulate the data in real life algo trading scenarios so then without a further Ado let’s get started before starting the video let me tell you something that we have two CSU files right so in the first file we have data of the traditional stock the crypto data and in the second file we have the fundamental research data so generally when we want to go longterm in any stock that time we use the fundamental research and that is also sometime crucial right and one more thing that this data is synthetic right synthetic means this is not the original data from any Source it was randomly created by the code so I have shared both the codes for both the data sets and you can use this code as per your requirement you can change some values you can change anything and you can use it as per your requirement so I’ll push this also to the GitHub you can clone the repo from there and you can use that right okay now as I have already explained you the agenda for today that what we will do we have two data sets and we will try to perform various operations which we generally perform in the real life algo trading scenarios right so in order to achieve that first we will clean the data then we will analyze the data and finally show you the data so what I’ll do I’ll just import the uh CSV files here so pd. read CSV and I will give the name of the file uh the first one is algo trading combine data set and what I will do here.
I will give this the name let’s say algo DF let’s make this consistent because we have worked on this data set previously so it will be easier for you also to understand right the next is PD read CSV and the name of the file is uh fundamental research data set and and let’s give this data frame the name as fun DF let’s hit shift enter and try to check out the data so the first one is algod DF which is this one and the second one is the funa DF so in the First Data frame alod DF we have 32870 rows and 7even columns which is basically a o lcv data and the second data frame is the Funda DF in that we have 150 rows and 10 columns so in that data frame we have the fundamental analysis the fundamental values and on which we can do the fundamental research and again let me reiterate this that both of these data frame are randomly generated data right so there is no real.
Value here the first question is identify all the top performing stocks based on their overall return from the start to the end of the data set right that means so let’s print the data frame and what this is saying that we want to display the top performing stocks right from the start to end so let’s first check that how many number of stocks we have in this data frame so for that what we can do we can check with the ticker so let’s print the value of ticker here and when we do that you will get 32,000 rows but we we want the unique values so for that we can use the function unique right and and you will get an array of unique values and so you can see that we have apple Google Microsoft Amazon Tesla Euro USD uh GBP USD USD JPY audusd USD CAD btcusd e USD xrpusd LTC bchn and nothing so means we have a mix of uh traditional stocks the Forex payers and the crypto our main goal here is to sort these stocks based on their performance and we can say in descending order right so we have seen that in the algod DF data frame we have the starting date is 1st January 2015 and the end date is 18th of September 202020 right so if you want to understand this in the chart we bought a share at this right and let me highlight this and that time the date was 20 2015 1 January right and.
I sold the stock at this place right and we can say that time the date was 20209 18th of September 2020 right means all these values are these 32870 rows are all these candles I think it’s clear right so now we can calculate on open or close so generally we select close so what we will do we will check that from this date the first one to the end which stock performed very well right in this time frame which stocks performed very well out of the stocks we have just seen in the array right so and we will check and the closing price of this date whether the stock was in profit or whether it was in loss okay now let’s understand with the code we want to find out the percentage return from the buy and the sale date right so what we can do here.
We can make this array as a variable so I’ll assign it let let’s say a name and it can be tickers right uh so at least if I want somewhere I can use this and let me print this tickers and you will get these value and if you want any particular value let’s say the first value you will get apple if last value you will get the BCS USD correct then what we can do we will create an empty list because in that list we will store the final values so let’s say I’ll give it the name as top the performance let’s say it can be anything good or bad performance and ampty list hope it’s clear up to this point now and let me print it again here now what I’ll do I’ll run a for Loop so for ticker and tickers we are running a for loop on this tickers we have seen the tickers array of all the unique tickers so let me show you again uh print ticker so you will get all the tickers correct the unique ones in reality we have these many rows but many of the rows have the same ticker so that’s why what we did we extracted the unique values out of this data frame now what.
I want to do I want to print One By One The tickers so you can print like algo and then the ticker is equal to Ticker the main thing is here we want to print one by one like the first we will extract all the values of Apple then Google then Microsoft and once we have all the rows of Apple then we can perform some operations the operations which have been asked in the question and it becomes a little bit easier for us right so I can show you this again also on the sideline so let’s print this here actually this is nothing but a filter so let’s say at the place of picker we have apple and I hit enter we will get a Boolean Series right and we have seen that.
If I want the filter data frame what we can do we can make it as a mask I’ll make it a mask and now I’ll write the name alod DF and you will get a filter data frame with only the rows containing apple right so same thing is happening here right so for that what I will do I will just make it as a mask and I’ll write I’ll go DF hope it’s clear up to this point right I can give here the name let’s say stock correct and then what I will do I will print stock the close of Apple so let let me show you here again in so what we will do let’s say I assign it a name and let’s say test stock and then test stock and the only the close column and let’s give it the name as test stock and let’s print the close column of this test stop so we know that this one is the column right same thing is happening here and now we want to calculate the performance.
So how we can calculate the performance so we know that let’s say if you bought any stock here right so this was the close of this candle and you sold here right so both values we are taking the close only so how we can find the performance means the price of the stroke here was 100 right then it shoot up and here it was 150 so now how you can calculate the performance you just have to you just have to subtract the last price the final price you can say here the final price when you sold so the final minus the initial price when you bought right you and you will get the 50 correct and if you want the percentage then what you can do you can just divide this by the initial price so final minus initial upon initial right so you will have 50 upon 100 and you will get as 0.5 means 50% you are in profit same thing is happening here what we are doing let’s say we find out that this is the first close price and this is the last close price so what we will do we’ll just subtract this value to this and we’ll divide by the initial price right and we’ll get the percentage performance of that value so here and now to extend the last column what we will do we’ll apply iock right the index and we can just do negative 1 and I’ll just copy and paste we know that the first value we can get from the zero and the last value we can get with the netive 1 right and we have to divide it with the first value so I will just enclose this in bracket and I’ll divide it with this value so what you will get as n so now you know that what is the issue with the missing values.
And how we handle them so let’s say I’ll change to Amazon and check with that and yes now we have 0.03 means Amazon performed neg 3% means whenever you bought the price and when you sold your amount was your value your net worth was 3% less means it didn’t perform very well so same thing we will apply with this loop on all these stocks right start with apple and end with bch hope it’s clear I tried my best to explain you still you have any doubt please let me know if we need to change our teaching style okay what I will do I will just copy this and paste it here and I’ll just remove this test because that is a name we are having here which is stock right we can assign a variable here let’s say overall return right for each stock so as we are running a for Loop here so one by one we’ll get all the values right and let’s give this the name stock data now what we will do we will store these value in the in this empty list right so what I will do I will just append this performance do append and I will give here let’s say so what we can do here.
First we can write the ticker name which is this one right ticker so I’ll just write here the ticker so what we are doing here we are appending at dictionary and that we have two values two key value pairs the first is ticker and the name of the ticker so the first will be apple and the respective value of that ticker so here we have found out the return so what I’ll do here I’ll write as over all return what will happen here the ticker name and the return the overall return will be stored in this empty list now what we can do here we can simply pass this list so how do we create a data frame with a list we have seen that previously PD dot data frame and then we’ll pass this empty list here so initially it was empty but now it is not empty right and one more thing we can do here is that we can sort the values that we can do with the the uh ticker name right overall return this will be a column right so we can sort with the return so we’ll get the result in the uh descending order so for that we have to pass it here and here we can say ascending is equals to false right so now when I had shift enter you will get the value and you will see that the top most performing asset is USD Cad and the lowest is the LDC USD or we can say these three stocks we not able to perform because of the missing values or we can say NN values it’s very straightforward you just have to focus this time so once you have understood these 10 questions I’m sure that in future you will you will have no issues performing these kind of operations correct so here we can do one more thing that we can assign to a new data frame that is return DF and then we can print this one return DF we can also set the index of this with set index and we have seen that we have to give the name of column which we want to make the index so it’s the ticker and now we have a series right so for that you have to check that return DF actually here you have to write in place is equals to and now you have a new data frame and which is a series you can check that with the type one more thing is remaining that is you have to squeeze it right which.
We have seen previously and now you will get a series correct and if you want you can also keep it as data frame also and here you can also plot this so let’s say plot and you will have a plot right with the top performing asset as the USD and the the last one is the bch which is not here because it didn’t have any value so the last one is BTC right now if you want you can change the kind of this so you can make it as and you will get a bar chart correct and for these the X label y label we will learn in future when we learn about the mat plot Li and if you want to understand now then let me know in the comments so from the next session what I will do I’ll explain you the mat FL Loop along with the pandas right now one more thing which is missing here that how to handle these values because sometime in the real life scenarios you cannot just missing values or three stocks unattended right so you have to do something with these so for that what you can do before starting the analysis you can clean the data right so for that we have to treat the NN values for that what I will do for now I’ll just comment out this and I’ll print the alod DF again here and we’ll run the function info and you can see here that we have total 32870 entries and we have missing values in these columns the Open high low and close but for now we know that we are only dealing with the close column right so what we can do we can just take the close column and let’s check the number of NN values here so what we will do we’ll write is Na and it will give us the Boolean series and again what we can do here we have seen previously that we can write some here and it will give the total number of missing values which is 1 941 so now we have few options one option is to remove the NN values and another option is to fill these values with some another value so generally in algo trading what we do we fill these values with something similar to the one value above or one value below so we have two options the back field and the forward field so now what we’ll do we’ll fill these values so we’ll write fill Na and here we have option which is forward fill here we have a parameter which is method is equals to for fill and then.
When we hit shift enter you will see that all the NN values have been filled with their previous value uh you can see here that this this NN value was same like this one also is having the same value so what is the benefit of this that now we will not get the error which we were getting in previously that three stroke we didn’t even able to find any value right so here you can see that this method is deprecated so for that we can find another way so this is your homework that you find any alternate way that how we can achieve this result with any other method or function right and here here in place is equals to True correct so when I hit shift enter now it has been changed and now when I again check this and is na a and I apply.
Here and now it says zero means now everything is okay so what I will do I’ll again go here and uncomment this right and now when we check you will see that we have the value of Apple which was earlier missing and again I guess this bch USD or some other values which were earlier missing but now we have all the values and I can show you again with this also and I remove this plot you will see that earlier we had three andn values yeah that was this for the first question uh you let me know if you have any issues any any problem you can let me know in the comments and we can discuss that again right okay the next question we have is how many instances of daily price change greater than 5% occurred for each stock right so for that what we will do first I’ll print the data frame and what we want to know that how many days when this close was greater than the open right for every day and we know that this one row stands for one day so what we will do now first of all
We have to check the none values and N values so for that we know that we can check with info function and it will show us that how many no null values we have so you can see here that we have many NN values and if you want to know exactly how many then you can apply is uh Na function and it will show you the Boolean data frame and then you can apply sum on that and it will give you exact how many values are NN so you have to deal with these vales otherwise it will create some problem which we have seen previously so for that what we can do we have just done that recently we will just apply.
The function fill Na and inside that we can use the method back fill or forward fill so in forward fill what will happen the value with the previous row it will fill exactly the same so here I’ll apply forward fill and we can also make it uh in place true so it will not create issue again right so it’s done so now if I check again the NN will use algo DF is n a and then I apply Su on that so it will show me zero means now we do not have any NN values right so now we can proceed comfortably with our question so the question is the percentage change so for that what we can do we can apply a function that is percentage change which we have understood recently so what I will do here I’ll apply PCT change and we have to apply on particular column actually so actually here actually here we just want to check the particular column that is closed so I’ll apply on this close and then I can apply PCD change and it will give me another column with the percentage change and what it will do it will compare with the previous day right always so now what you can do you can create another colum in this data frame and let’s say give it the name as alod DF and daily change right and I’ll hit shift enter and we have another column let me show you this one right daily change so in that the first is NN value and why because for the first day there was no reference value right because in pctd change it calculates with the previous value so the first value it will always be n in value correct now we want to check greater than 5% so for that what.
We can do I can apply a filter on this daily change and I can write like daily change greater than 0.05 and it will return a Boolean series and on that I can use that as a mask and I’ll get a data frame which is only having the daily change more than 5% right so we can also store this in another column so let’s say I’ll make the column name as high change and hit shift enter and now let’s check and you will see that it says cannot set a data frame with multiple columns to the single column High change.
Watch this Day 26 video tutorial
Day 26: End to End Stock Analysis Pandas Dataframes In Python