Descriptive Statistics Part-3 | Day 38 of 100 Days of Python Algo Trading
Welcome to Day 38 of our 100-day journey into Python Algorithmic Trading. Today, we delve deeper into descriptive statistics, focusing on essential concepts like quantiles, quartiles, quintiles, deciles, percentiles, and their significance in data analysis.
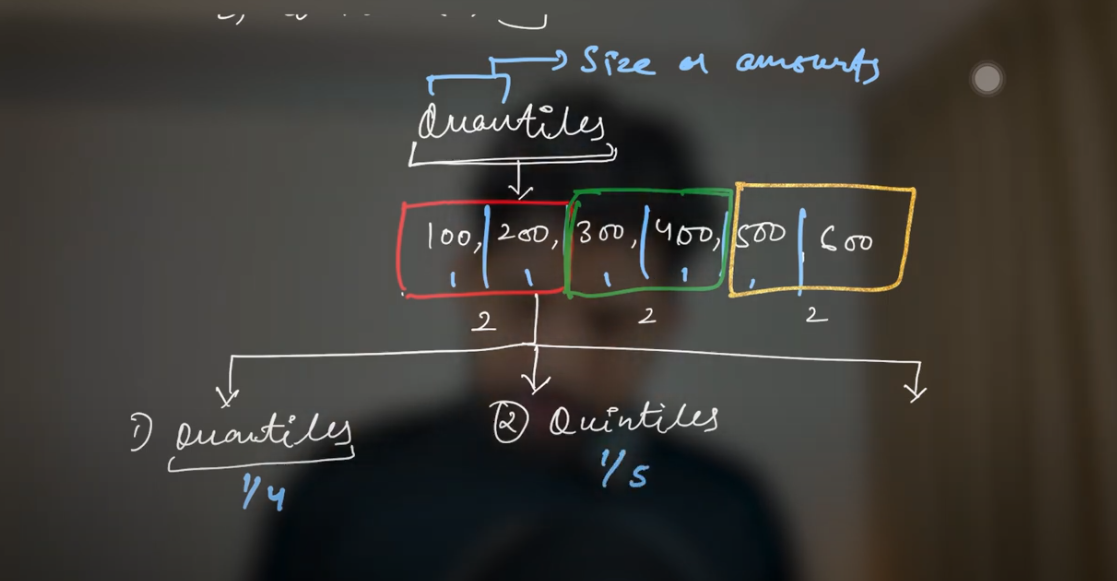
Understanding Quantiles
In statistics, quantiles are values that divide a data set into equal-sized intervals, each containing the same number of data points. This division aids in understanding the distribution and spread of the data.
Types of Quantiles:
Quartiles: Divide the data into four equal parts.
Quintiles: Divide the data into five equal parts.
Deciles: Divide the data into ten equal parts.
Percentiles: Divide the data into one hundred equal parts.
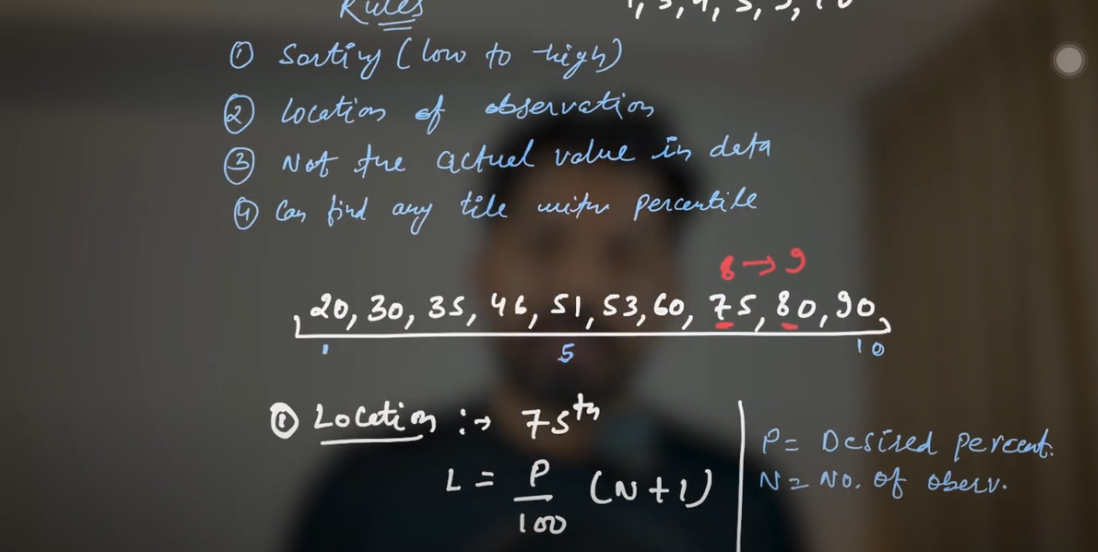
Key Rule: Always ensure your data set is sorted in ascending order before calculating any quantiles.
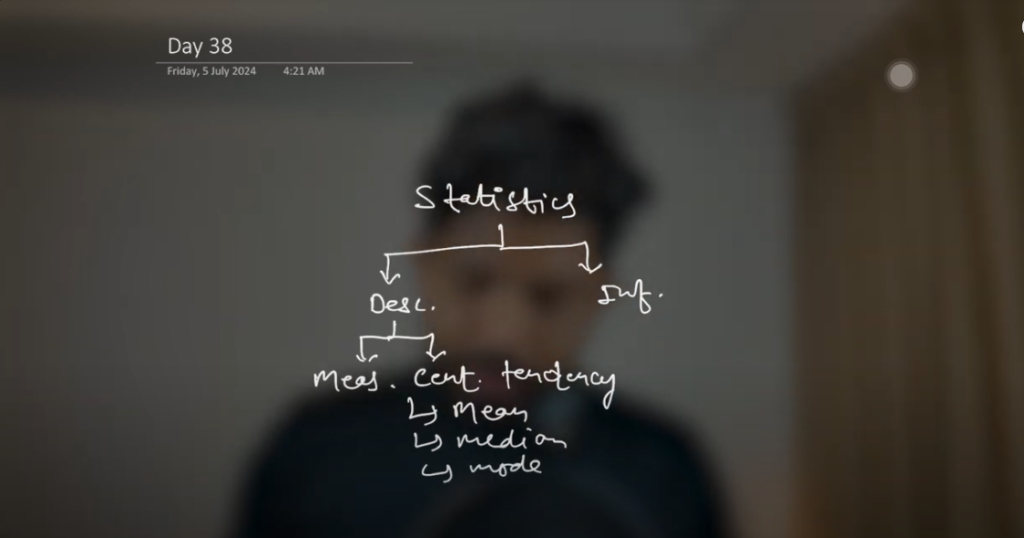
Measures of Central Tendency
Central tendency measures provide insights into the central point of a data set. The primary measures include:
Mean: The average of all data points.
Median: The middle value when data points are ordered.
Mode: The most frequently occurring value in the data set.
Measures of Dispersion
Dispersion measures indicate how spread out the data points are:
Range: The difference between the maximum and minimum values.
Variance: The average of the squared differences from the Mean.
Standard Deviation: The square root of the variance, representing data spread.
Measures of Dispersion
A concise way to describe a data set includes:
Minimum: The smallest data point.
First Quartile (Q1): 25th percentile.
Median (Q2): 50th percentile.
Third Quartile (Q3): 75th percentile.
Maximum: The largest data point.
Exploratory Data Analysis (EDA) in Algorithmic Trading
EDA is crucial in algorithmic trading as it helps uncover patterns, detect anomalies, and test hypotheses. Key components of EDA include:
Univariate Analysis: Examining individual variables using histograms or box plots.
Bivariate Analysis: Exploring relationships between two variables using scatter plots.
Multivariate Analysis: Analyzing more than two variables to understand complex interactions.
Visualization Techniques
Effective data visualization is vital for interpreting complex data sets:
Histograms: Show the frequency distribution of a single variable.
Box Plots: Highlight the distribution and potential outliers in the data.
Scatter Plots: Illustrate relationships between two continuous variables.
Importance of Correlation and Covariance
Understanding the relationship between variables is fundamental:
Covariance: Indicates the direction of the linear relationship between variables.
Correlation: Measures both the strength and direction of the linear relationship, standardized between -1 and 1.