
Hello friends, welcome to Day 32 of 100 Days of Hell with Python Algo Trading.
In the last session, we learned about Multi-Indexing and understood it with many good examples. Hope you got everything clear. We also shared some Multiple Choice Questions, Task Questions and a Mini Project, which you must have seen.
Today we are going to learn three very important concepts of Python Pandas –
- melt() function
- pivot_table() function
- Vectorized Operations on Strings
Start by understanding Long and Wide Format Data
First of all, we need to understand what is the difference between Long Format and Wide Format data:
- Wide Format: It has only one row for each data point but there are many columns. Meaning fewer rows and more columns.
- Long Format: It has many rows and fewer columns according to the attributes. Meaning more rows and fewer columns.
So when we apply melt() function, our Wide Format data is converted to Long Format.
Melt Function – Convert Wide to Long
melt() is used to normalize data so that we can easily analyze or visualize it, especially for time series analysis or machine learning models.
Example:
If we have O-H-L-C-V data for Apple, Amazon, Meta, Microsoft, then with the help of melt we can bring that data into a structure which makes analysis easier.
You can say –
“Melt function converts wide format data to long format.”
Pivot Table – Magic Function
pivot_table() is a very powerful function that makes things like GroupBy very easy. With its help, you can reshape any data frame as per your requirement.
Example:
If you have some tickers and their prices and you want them to be indexed by ‘ticker’, ‘year’ column and ‘close’ values filled, then pivot_table() can do this in one line.
Use Cases in Algo Trading:
- Summarizing trading data like finding average daily return.
- Making comparisons between different assets.
- Frequency analysis of signals.
Vectorized Operations on Strings – Fast and easy string processing
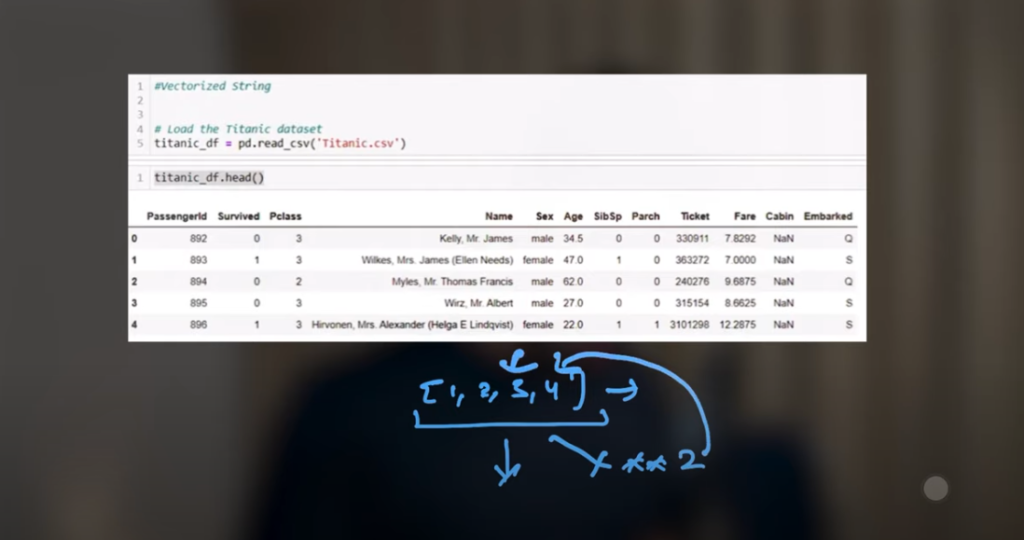
Python’s core string operations are a bit slow and less efficient, but in Pandas we can do vectorized string operations with the help of numpy arrays – which performs operation on every string element simultaneously.
What does Vectorized mean?
For example, there is a list [1, 2, 3, 4], if we want to square it, then in normal Python we will have to apply a loop. But if we use numpy array, we can directly do array * array – and each item will be operated upon simultaneously.
This is vectorized operation.
Speed is important in Algo Trading, so vectorized string operations are very useful.
Let’s understand by coding
Let’s first create a simple DataFrame:
import pandas as pd
df = pd.DataFrame({
“Apple”: [100],
“BTC”: [2000],
“Microsoft”: [3000]
})
Now if we apply pd.melt(df) then our wide format data will be converted into long format.
Now if we take another example where we have some tickers:
df = pd.DataFrame({
“Ticker”: [“Apple”, “BTC”, “Microsoft”, “Meta”],
“Price”: [100, 200, 300, 400],
“Year”: [2021, 2022, 2023, 2024],
“Close”: [110, 120, 130, 140]
})
Now if we apply melt() on this:
pd.melt(df, id_vars=[“Ticker”], var_name=”PriceType”, value_name=”Value”)
Then all the other columns will be melted into a long format, and it will be very easy for data analysis or plotting.
Melting data from Yahoo Finance
import yfinance as yf
tickers = [‘AAPL’, ‘AMZN’, ‘META’, ‘MSFT’]
df = yf.download(tickers, start=”2022-01-01″, end=”2022-12-31″)[‘Close’]
df_reset = df.reset_index()
df_melted = pd.melt(df_reset, id_vars=[‘Date’], var_name=’Ticker’, value_name=’Price’)
Now you can plot(kind=’bar’) this melted data and see a nice bar chart.
Watch this Day 32 video tutorial
https://www.youtube.com/watch?v=GhtjL0Dgz-kDay 32: Vectorized String Operations