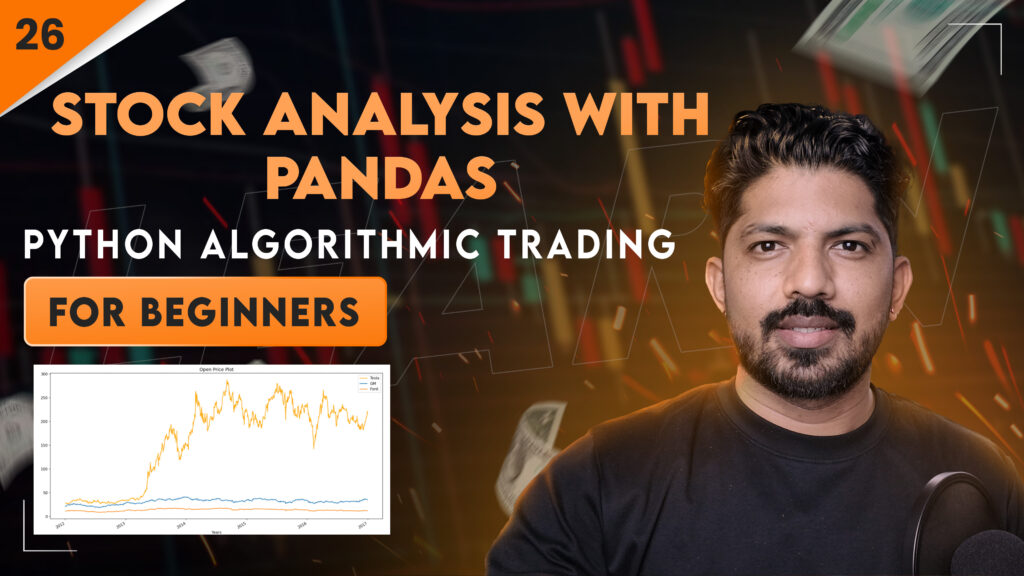
Use of Pandas DataFrame in Algorithmic Trading
What is Algorithmic Trading?
Algorithmic Trading has become the basis of today’s modern trading system. In this, trading decisions are made automatically with the help of computer programming and data science. In this process, the data is deeply examined and analyzed so that the decision to buy and sell can be taken at the right time.
Importance of Pandas DataFrame
Pandas DataFrame is a very important tool in algo trading. With its help, we can easily manage, analyze and visualize financial data. Using Pandas, we can convert raw (bare) charts into DataFrames, which can be further converted into strategies.
Data Conversion from Chart to DataFrame
The first step in algo trading is to convert the bare chart into a data frame. In a candlestick chart, we get five important values:
- Open
- High
- Low
- Close
- Volume
Together, it is called OHLCV data. When we convert this data into Pandas DataFrame, we can perform various calculations and analysis on it.
Important functions and attributes of Pandas
In today’s blog, it was explained how learning some special functions and attributes of Pandas is very important for algo trading. These functions will help you filter, group, summarize and visualize the data.
For example:
df.head(), df.tail()
df.describe(), df.info()
df.groupby(), df.mean(), df.median(), df.std()
Data selection via .loc[], .iloc[]
Conversion from algorithm to dollar and percentage profit
Once you have created your strategy code, you can also find out how much profit you made. All you have to do is:
(Final Price – Initial Price) / Initial Price
If this value comes out to be 0.5, it means you made a profit of 50%.
Using Matplotlib and Bar Chart
Using Pandas as well as Matplotlib, we can show our data in a graph. For example, a bar chart can be created using kind=’bar’, which helps to show profit and loss in a visual form.
Data Cleaning and Analysis Process
The blog also explains that when we do real-life algo trading, it is important to clean and analyze the data. For this:
- Removing or filling missing values
- Removing duplicate entries
- Normalizing the data
All these steps are necessary so that our trading strategy is accurate and effective.
Using two data sets
This session used two files (CSV format):
- Algo Trading Combined Dataset — which contains trading data in OHLCV format.
- Fundamental Research Dataset — which contains fundamental data needed for long term investing.
Note that both these data sets are synthetic (randomly generated), i.e. they are not taken from any real stock exchange, but are created for demo.
Strength of basics is most important
The blog specifically mentioned that it is not possible to do algo trading without understanding the basics. If your basics of Pandas, Python, and data analysis are strong, then you can easily convert any chart into code and turn that code into dollar or percentage profit.
This video and blog of Day 26 is very important for those learning algo trading. It explains how you can convert a simple chart into a data frame and apply strategies on it and then turn it into profit.
If you are interested in algorithmic trading, Pandas, Python and data analysis, then this blog is icing on the cake for you.
Watch this Day 26 video tutorial
https://www.youtube.com/watch?v=DL9BYUjR8rs&ab_channel=KuldeepSinghRathoreDay 26: End to End Stock Analysis Pandas Dataframes In Python